Wealth distribution is a comparison of assets, income, and earnings among a group, or multiple groups of people. In a utopian world, wealth distribution might look like a straight or slightly slanted line on a graph that represents wealth as an equal or relative measure shared by all. Unfortunately, both global and U.S. national wealth distribution inequality is rising as the economic gap broadens, and the top 1% is rapidly increasing in wealth while the rest of the population flounders.
The terms “wealthy” and “rich” are not the same. Wealth is the accumulation of assets such as capital held in bank and/or savings accounts, property and housing, stocks and bonds, and pensions, minus any liabilities or debts. Wealth describes net worth. The term “rich” is more commonly used to describe a large income.
Income plays an important role in wealth but does not define it. A large income paired with nearly equal debts does not create a high net value (or “wealth”), but an income that satisfies debt and living expenses with room to spare creates further financial growth and investment opportunities. Capital provides the ability to increase wealth via asset investment. In essence, it takes wealth to make wealth.
Unfortunately, people with low wages generally lack the ability to invest for meaningful return. A low-income household is also more susceptible to economic setbacks due to life events such as an unexpected bill, illness, or natural disaster. These often equate to negative wealth — the value of debts exceeding the value of assets and income.
In a 2019 report from the Institute for Policy Studies, One in five U.S. households have zero or negative wealth. Further broken down, the report shows that families of color are more at risk, comprising a disproportionate ratio of negative-wealth households. Of the 20%:
- 37% are black families;
- 33% are Latino families;
- 15.5% are white families.
Indigenous and more diverse people of color were not specified or mentioned in the study.
Table of Contents
How Is Wealth Distributed Globally?
According to Forbes, the ultra-rich are worth $8.7 trillion in combined wealth. This amount is greater than what many countries can produce in goods and services on an annual basis. For further perspective, consider the top three largest economies’ gross domestic product (GDP):
- The United States: $19.39 trillion;
- China: $12.24 trillion;
- Japan: $4.872 trillion.
The gross world product was calculated by the Statistic Times by combining the gross national product of all of the countries in the world for 2018 at $84.84 trillion. This means that the ultra-rich own 10% of global finances.
The 2018 Credit Suisse Global Wealth Report provides data of where the top 10% of the global wealth holders reside:
| United States | 20% |
| China | 18% |
| Japan | 11% |
| France | 5% |
| Germany | 5% |
| Italy | 5% |
| United Kingdom | 5% |
A whopping 69% of the top global wealth resides in 7 countries, exhibiting the unequal distribution of wealth globally.
The report also includes data stating that the world’s top the top 10% own 84% of wealth, the 1% own 47.1% of global wealth, and the bottom half of the adult population collectively owns less than 1% of total wealth globally.
These percentages indicate that a person needs:
- $4,210 USD to be included in the wealthiest half of world citizens;
- $93,170 USD to be included in the top 10% of global wealth holders;
- $871,320 USD to belong to the top 1%.
Global wealth has unequal distribution within a small percentage of the population and few regional places. So what does the wealth gap mean for the global middle class?
First, let’s define the global middle class.
Global classes are defined by the Brookings institute to include four spending groups:
- The extreme poor: 630 million people below $1.90 per day
- The vulnerable, at-risk, or near-poor: 3.16 billion people between $1.90-$11 per day;
- The middle or consumer class: 3.59 billion people between $11-110 per day;
- The rich: 200 million people above $110 per day.
The global middle/consumer class is growing and expected to continue to grow, meeting a projected population of 5.3 billion people by 2030. This means that more and more of the global population will have access to water, food, transportation, and healthcare.
With this continued growth and upward movement of the population, it would seem that wealth distribution would find a healthier balance — but a theoretical process called wealth concentration prohibits distribution of the highest concentrations of wealth. The cycle of wealth concentration is fairly simple: those who possess wealth create wealth. People who already hold wealth have access to resources to continue creating accumulating wealth. This cycle extends into generational wealth and economic advantages such as access to education, technology, healthcare, and control of financial markets.
Wealth Inequality in America
When considering the wealth gap between the <1% and the median American family, the Institute for Policy Studies states that between 1983 and 2016:
- The median American family experienced a wealth drop of 3%;
- The richest 0.1% experienced an increase of 133%;
- The annual increase for a white median family wealth was $1,000 annually;
- The annual increase for a Latino median family wealth was $66 annually;
- The black family median decreased $83 annually;
- The richest 1% experienced an increase annually of $500,000.
What Causes Wealth Inequality in the U.S.?
The wealth gap in the U.S has increased over the last 30 years and can be attributed to multiple systemic issues:
- Historic socioeconomic and income inequalities, which are still critically challenging the possibility of economic growth.
- Unequal and unlivable wages which do not provide enough income for American families to build wealth while meeting basic needs.
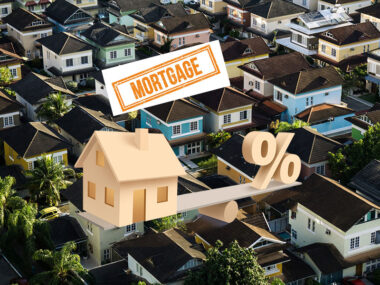
- The availability, expense, and debt it takes to achieve higher degrees of education, which are associated with higher incomes.
- Growth in technologies, which eliminates jobs.
- A lack of wealth tax for the wealthiest 0.1%-1%.
- Dynastic or generational wealth, which is created through economic concentration and is influenced by the weakening of inheritance taxes.
Additionally, a 2017 study from the Federal Reserve on the economic well-being of Americans found:
- Four out of ten American families would not have the cushion of $400 in an emergency.
- Over one-fifth of American adults cannot pay their monthly bills in full.
- Over one-fourth of American adults could not receive necessary medical care due to the inability to afford the cost.
- One-fourth of black people are not confident that a new credit application would be approved — this is twice the rate among white people.
The American middle class is roughly defined by income, spending power, and financial ability to comfortably buy a home, raise a family, and hopefully retire. Many Americans consider the working class to be the middle class, but, while the economy continues to grow, many Americans are being left behind due to stagnant wages and inflation. According to the Pew Research Center, the 1973 hourly wage of $4.03 had the same purchasing power as a $23.68/hour wage today. Paycheck size may have increased over the last 40 years, but purchasing power has not kept up.
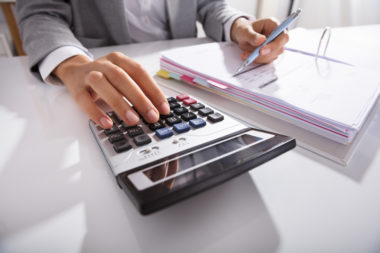
The lack of purchasing power through stagnant income is not the only setback for the American middle class; it is also compounded by a high rate of denial for credit.
The 2017 Federal Reserve study also found that 39% of applicants with annual incomes under $40,000 were denied credit, while only 10% of applicants with incomes over $100,000 annually were denied. The study also found that four in ten American adults applied for credit in 2017. Out of those who applied for credit, 25% were denied at least once, and 32% were either denied or offered less credit than requested. The rate of denial also differs by the family income of the applicant, as well as race and ethnicity; black and Hispanic people are more likely to report negative credit outcomes.
While it takes wealth to make wealth, the middle class lacks purchasing power and faces higher rates of credit denial. This seriously inhibits this class’s ability to borrow enough money on credit to make investments, start a business, or buy a home.
Redistribution of Wealth
Breaching the wage gap and breaking the cycle of poverty requires a top-down political approach for redistribution of wealth. This includes wealth taxes on the ultra-rich and revenue redistribution programs that directly benefit low-income populations, such as:
- Reconsidering the inheritance tax to break apart concentrated and untouchable wealth dynasties.
- Investing in affordable housing to create wealth-growth opportunities with a focus on communities of color.
- Raising the minimum wage to reflect a livable wage of at least $15 per hour.
- Ensuring job opportunities, protection, and equal pay to all genders, people of color, and indigenous peoples.
- Creating healthcare opportunities that protect American families and offer medical treatment as a right rather than a privilege.
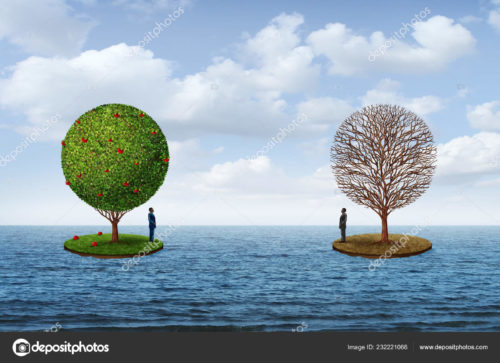
Image Source: https://depositphotos.com/